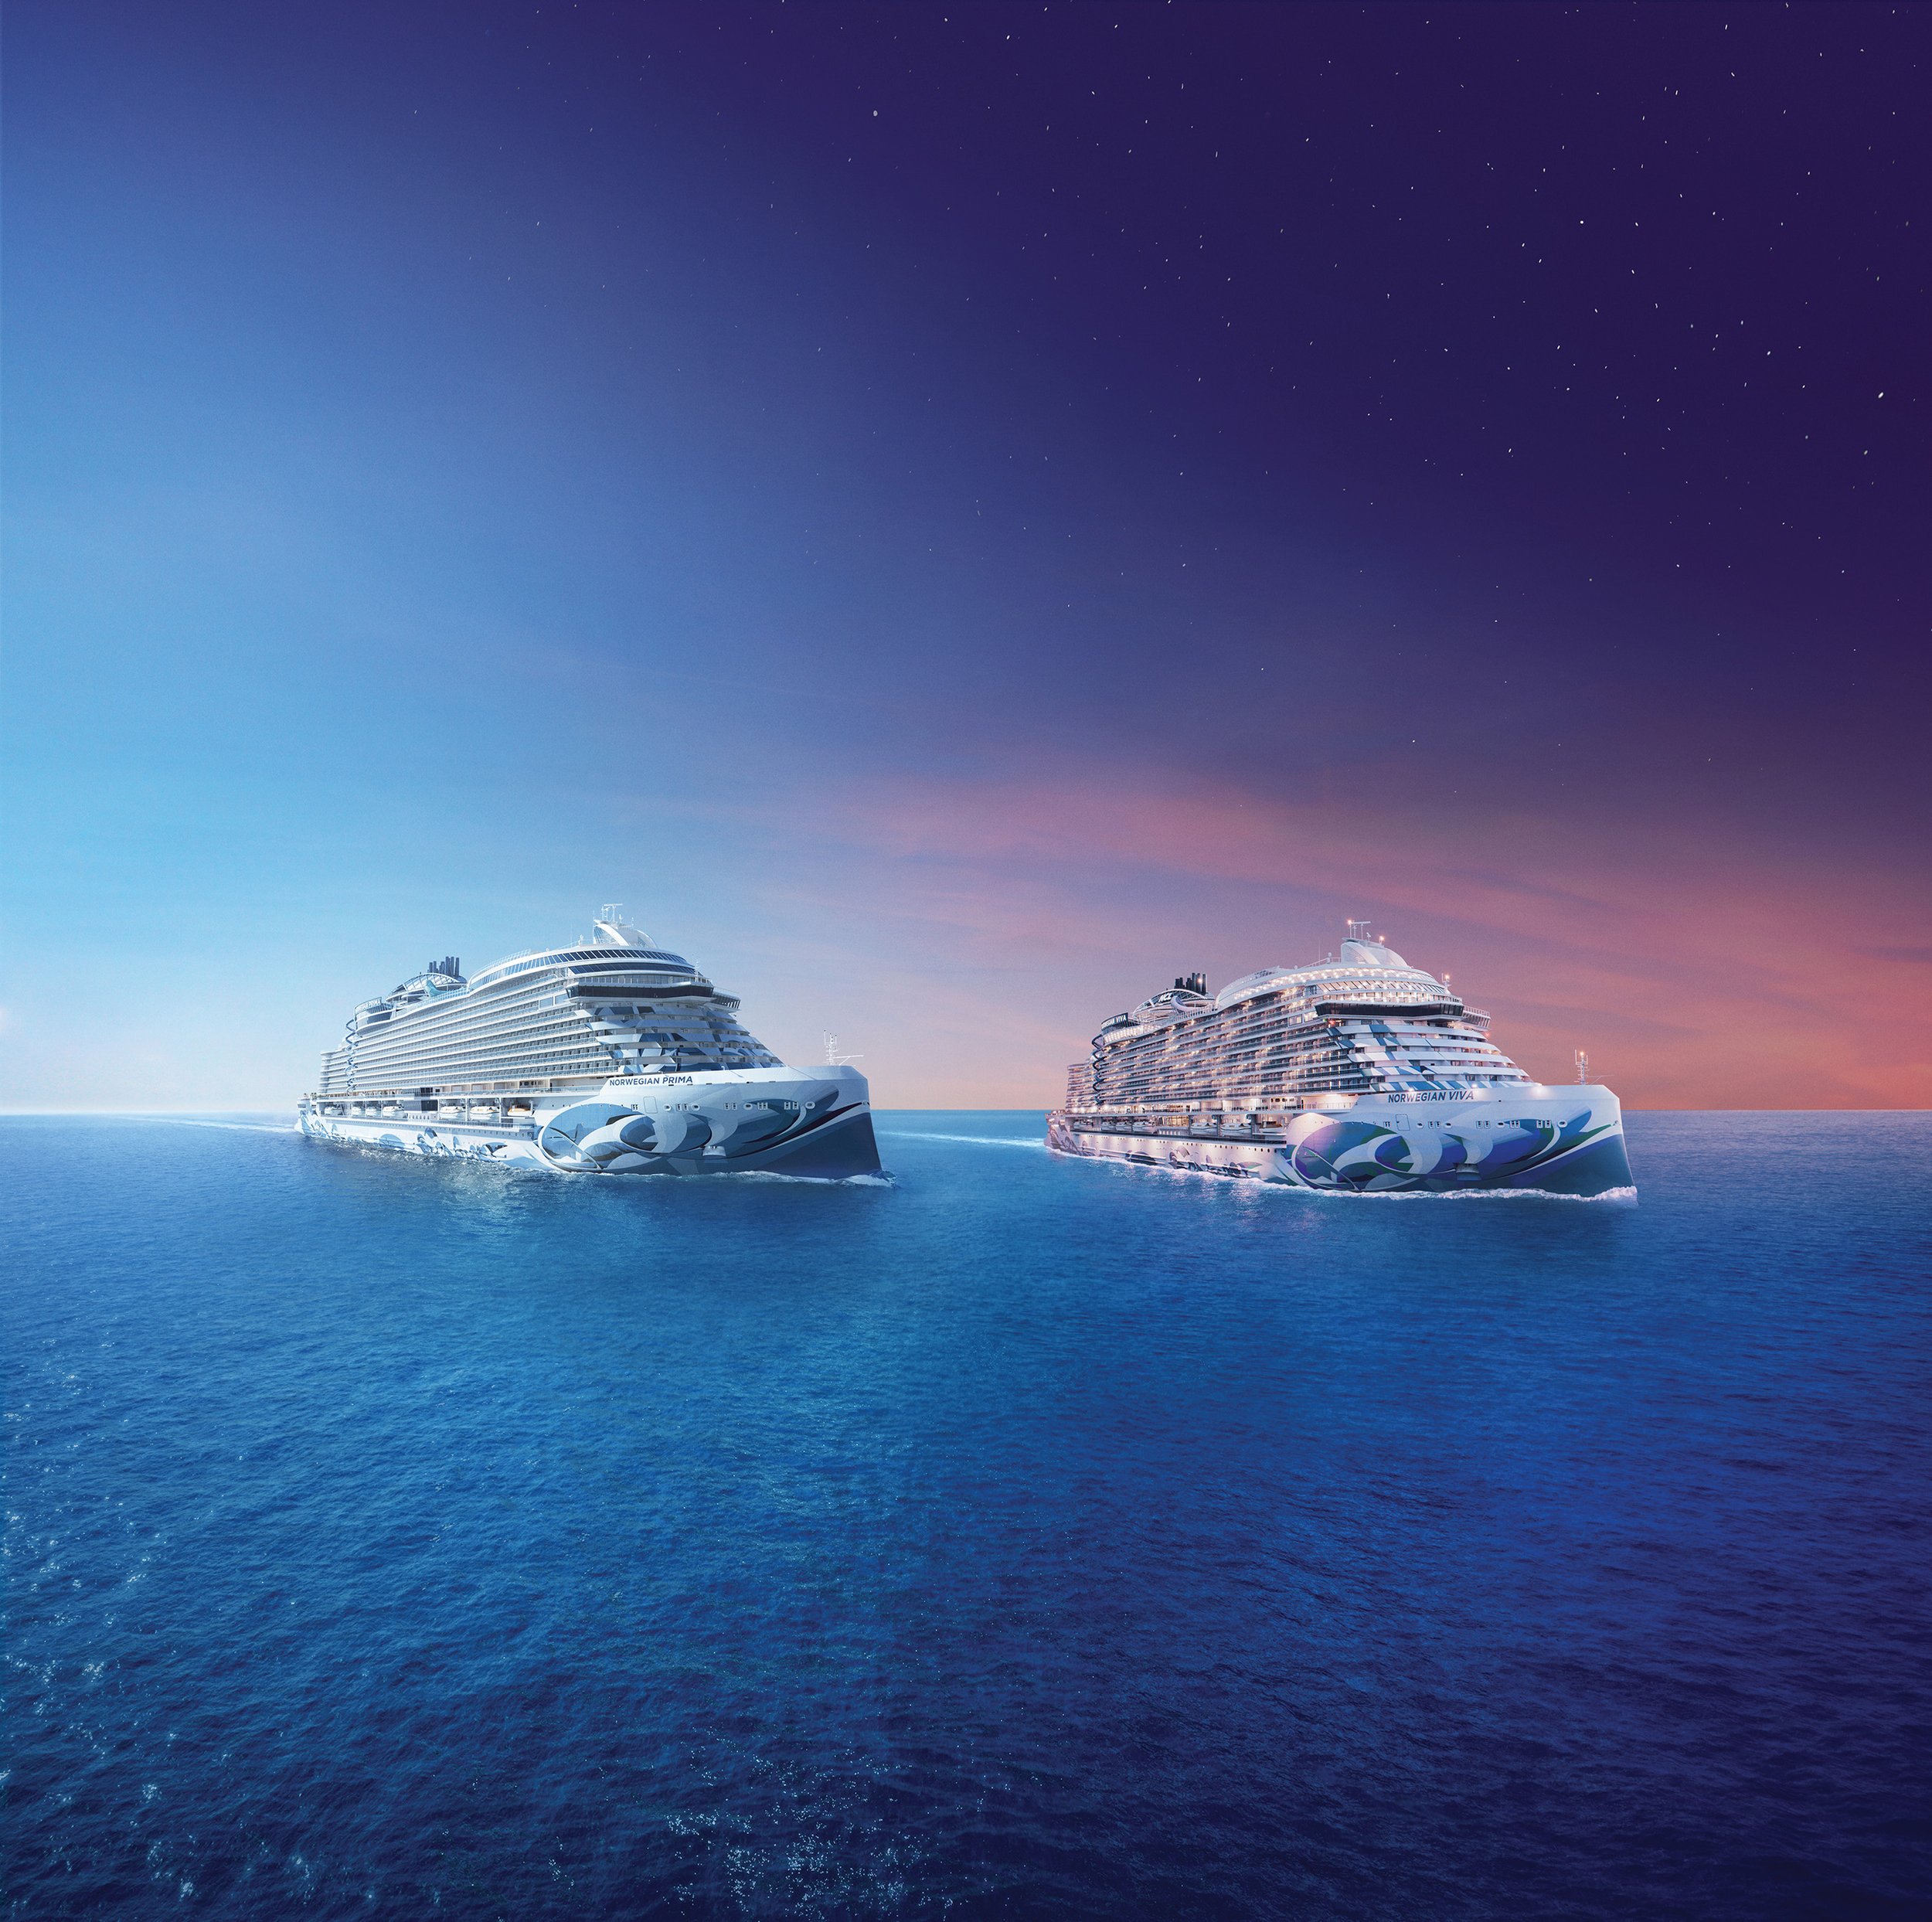
Norwegian Cruise Lines Product
Card Redesign
For more than 56 years, Norwegian Cruise Line has led the way as a pioneer in the cruise industry. they introduced the groundbreaking concept of flexible dining schedules, empowering guests to cruise at their convenience to over 450 breathtaking destinations worldwide.
The Background
Norwegian Cruise Line facilitates numerous excursion bookings through its website and mobile application. Given the prevalence of app usage among users, particularly while on the move, I endeavored to devise a solution for redesigning the excursion booking interface to enhance user experience.

Previous UI
As the sole UX Designer, I managed user experience and design from the initiation phase to the product launch. This involved organizing the content and visuals to ensure optimal mobile user experience.
Team
One UX Designer
Design Direction
NCHL Design
My Role
Product Designer
Tools
Figma
Adobe Creative Suite
The Process
Discovery - Competitive & User Research, Contextual Gathering
According to Frommer’s the typical NCL passengers are couples ages 25 to 60, and include a fair number of honeymooners and families with kids during summers and holidays. I conducted a competitive analysis of cruise lines targeting the same demographic.
Data Synthesis/Empathize - Identifying opportunities & pain points
As Norwegian Cruise Lines is suited to a wide age range we can create an experience that is both interactive and appealing for young users, yet simple for older users to navigate.
Jakob Nielsen’s eye-tracking study from 2008 indicated that less than 20% of the text content is actually read on an average web page.
Our brains were built for visual information:
1. 90% of the information processed by the brain is visual.
2. It takes only 13 milliseconds for the human brain to process an image.
3. The human brain processes images 60,000 times faster than text.
4. People remember 65% of what they see, compared to ten percent what they hear.
5. In responses to a recent survey, 95% of B2B buyers said they wanted video content.
6. Publishers that feature visual content grow traffic 12 times faster than those who don’t.
via Movable Link
Potential pain points
As a reference from the data, we can potentially conclude that users value images over text to conceptualize information. Consequently, the original design may be perceived as verbose by users across various age demographics.
User Personas
Jason & Christy
Ages: 35, 33
Jason and Christy are young, tech-savvy millennials that always use apps to navigate their travel experiences.
Charles & Janice
Ages: 59, 52
Charles and Christy are an energetic couple who are not very familiar with technology but are interested in seeing what is available while on the go.
Design & Solution
To streamline user experience and ensure comprehensive information dissemination, I implemented a potentially scrollable (depending on the amount of content) content carousel to present vivid imagery depicting the excursion, affording users an immediate insight into the trip's offerings.
Additionally, I integrated a video card feature, enabling users to delve deeper into the excursion's intricacies and offerings. This particular card would possess the capability to expand into a full-screen interface, emulating the functionality observed in other immersive full-screen experiences. Furthermore, leveraging insights gathered from my research findings, I optimized the content on the card by reducing verbosity, as studies suggest that users tend to engage more effectively with concise, shortened messaging complemented by imagery.
Furthermore, I incorporated an additional ideation feature comprising insights and recommendations derived from past user reviews, curated through AI-driven methodologies, aimed at enhancing the overall excursion experience.
Lo-fi Wireframe
Hi-fi Screen
Next Steps
The next steps of action would entails meticulous troubleshooting of the component and subsequent iterative enhancements guided by user & leadership feedback.
Furthermore, I would aim to delve deeper into the integration of AI elements and their potential to enhance the overall booking experience, thus adding significant value to the platform.
Success Metrics:
Measuring retention & evaluate the percentage of users who repeatedly engage with the new features
User Satisfaction based on user reviews


